Instant reports, professional interactive dashboards — one layout, one tool

Convert site inputs into clear dashboards. Explore any area with a click, produce progress reports in seconds, and get instant insights with report-ready visuals your team can trust.

Key Benefits

Everything you need to manage
site issues effectively

Progress reports in seconds

Build report-ready views and prior data configuration setup without reworking spreadsheets.

Click-to-analyze areas

Drill by zone, trade, date.

No more XER juggling

Avoid importing multiple files just to find a number.

Smart workflows

Use automations to standardize routine reporting and analytics tasks.

Stronger stakeholder trust

Crisp visuals that communicate value on the spot.

Core Features

Built with the latest technology for maximum
reliability and performance

Unified Data Model
Connect schedule data and normalize into a clean, query-ready schema.
Themes Templates
Prebuilt layouts and styles that keep every deck consistent and on-brand.
Professional Presentation
Present progress live or export images/PDF for quick handouts.
Share Interactive Dashboards
Easily share the entire report with any user to enable viewing and interactive analysis.

From raw site data to clear answers — instantly.

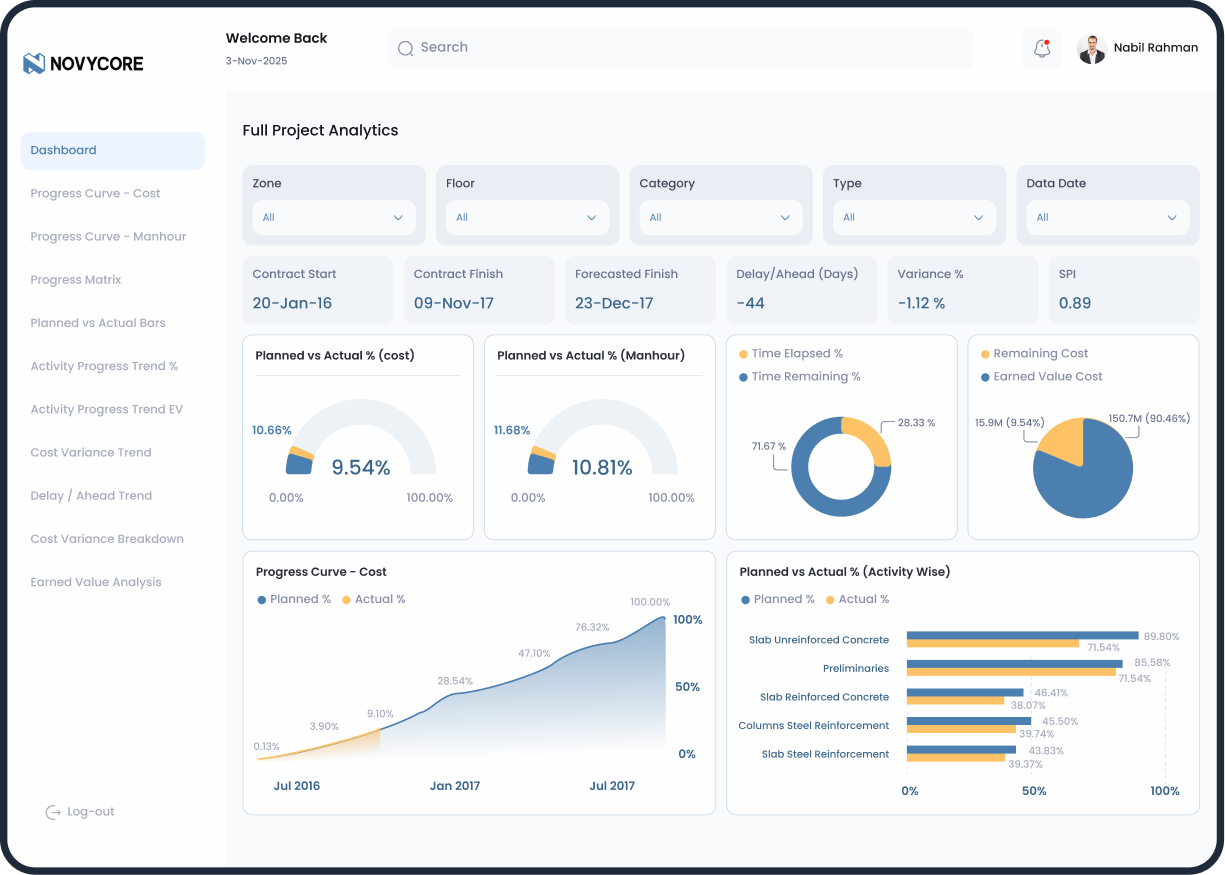
Site Analytics brings all planning, progress, and site data into intelligent dashboard views. Instead of chasing files and recalculating reports, teams gain instant insight to prepare reports, analyze progress and support decisions.

Everything in one place

From mobile capture to manager dashboards, Site Issues keeps your entire team aligned with real-time updates and complete visibility.

Instant photo attachments
Real-time status updates
Automated notifications
Comprehensive history tracking
Export and reporting tools

Request a Demo

Thank you! Your submission has been received!
Oops! Something went wrong while submitting the form.